


PlanetTogether’s Gantt chart is interactive, intuitive, and customizable, enabling schedulers to create a manufacturing schedule that is simple and easy to understand. Using a Gantt chart to a schedule helps manufacturers reduce costs, improve efficiencies, improve on-time deliveries, and improve capacity usage.
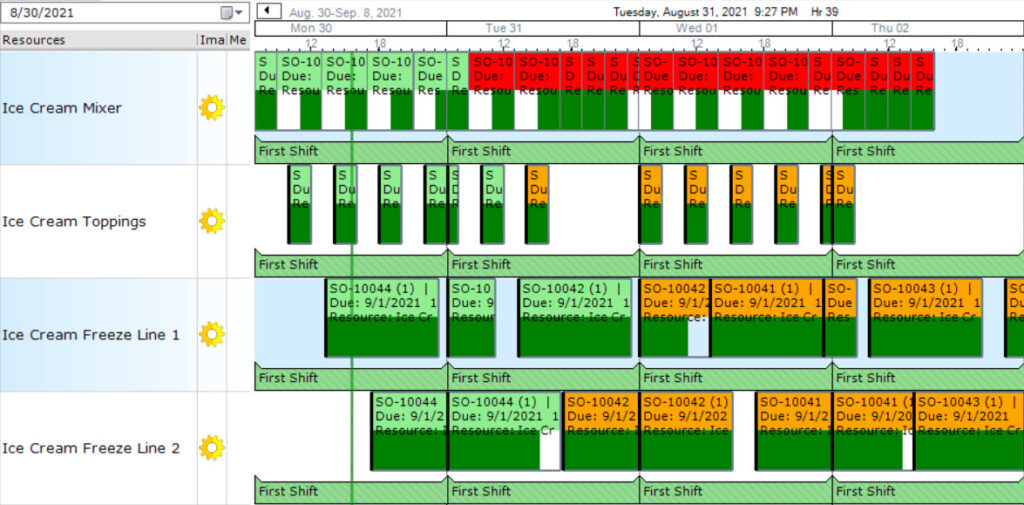
PlanetTogether’s Gantt chart is highly customizable, allowing the choice of the information displayed for each activity. Whether you need to know the item, customer, quantity, product attribute, timing, due dates, etc., the options are there to display the information you need.
In addition to data, colors are also used as visual cues to understand more about the scheduled activity. There are 9 different segments for each activity that color codes can be used such as whether the activity is on time or late, if the activity is running, on hold, or waiting, or if there are any material shortages.
The Gantt chart can be kept simple with minimal data and color-coding necessary to build an executable schedule or with several rows of information to define the activity scheduled and several segments of color to offer more visual cues.
To find out more about PlanetTogether and how visual scheduling using a Gantt chart can help your operations please contact Scheduling Solutions by email at: info@lsi-scheduling.com.